
 Deutsch
 Español
 Français
 Eesti
EestiMethodology and tools

In the course of the three years, the most relevant information is collected to be able to assess the vulnerability to climate change of different types of crops at farm level. Qualitative and quantitative data have been analyzed with two tools developed during the project. Information on the different areas in the EU, compiled and analyzed for a better understanding of the challenges of adaptation to climate change in a European scenario, is transferred to political decision-makers.
One of the key elements of the project is working at farm level. The main aim of the farm level assessment is to increase the awareness among farmers about their climate vulnerability and to increase their climate resilience. This is done by conducting the assessment on farm level and elaborating an adaptation strategy on farm level.
Step 1: adaptation strategy at farm level, through progressive elaboration of long-term action plans and sustainable adaptation measures classified in Efficiency, Substitution or Redesign categories. This is done together with the farmers, according to the feasibility of the adaptation options in terms of environmental and economic sustainability.
The elaboration of this adaptation strategy will increase the farmer´s awareness of their vulnerability to climate change. During the project we want this awareness to increase from phase 1 to phase 4.
Step 2: raising awareness among farmers about climate vulnerability, 4 phases.
- Phase 1: unknown vulnerability. Climate change is often unclear for farmers. It is necessary to make an effort and show climate change implications and the expected climate trends in their regions. Farmers are focused on weather and not climate (short term view). It is necessary to explain the main differences between weather and climate change, and even explain that climate change is based on scientific evidence.
- Phase 2: vulnerability is known but solutions are not identified. Through Agro-Climate Indicators (ACI) which illustrate climate trends and the farm vulnerability. This is done by using tools for assessing the:
- Climate strengths and weaknesses at two different scales:
- for different crops and farming systems at Agro-Climatic Zones (ACZ) level.
- at farm level including the main crops and systems through a SWOT analysis.
- Vulnerability in the Near Future (NF), about 2030.
- Climate strengths and weaknesses at two different scales:
- Phase 3: vulnerability is known and solutions identified, though their efficiency is still unknown. Progressive elaboration of an action plan for the pilot farm to achieve a feasible adaptation to climate change. Action plans are elaborated together with farmers.
- Phase 4: vulnerability is known, solutions identified and efficiency quantified (advantages and disadvantages).

TOOLS
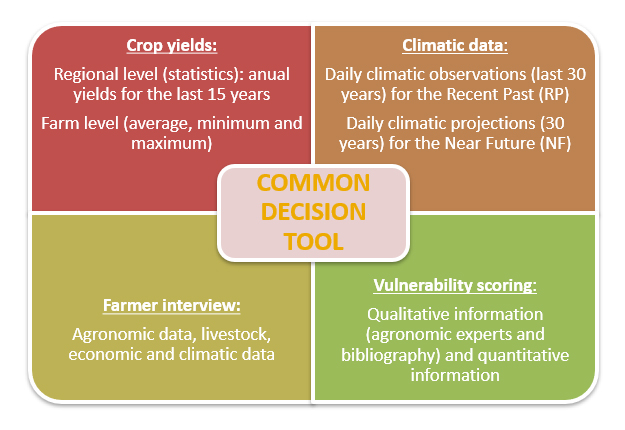
Two tools have been created to help in the decision making process. The objective of these tools is to assess the vulnerability to climate change at farm level, and implies the conversion of climatic events into agronomic impacts for a determined crop or activity (profitability, crop pests, etc. …). It will be used to recommend adequate adaptation measures for the four main EU Climate Risk Areas.
- Agro-climatic zone tool:
With this tool, an assessment of crop vulnerability to climate change at Agro Climatic Zone Scale is performed. This analysis provides a framework for the second step of analysis at farm level. The assessment crosses climatic data with crop yields at a regional scale and it allows to identify in a recent past period the strongly impacted years, main climate events, etc. Previously, research for the different crops is performed (ID card crops), where the main crop characteristics are defined, as well as the main crop stages and their calendar. This way, the main Agro Climate Indicators to be defined by the tool are identified. The information to be included in this tool can be seen below:
- Climatic data for the Recent Past (last 30 years). The source of climatic data is the Data Portal Agri4Cast. This portal collects gridded Agro-Meteorological data in Europe, meteorological parameters from weather stations are interpolated on a 25x25km grid. Data available from 1975 to the last calendar year completed, covering the EU Member States. The variables collected can be seen below:
-
-
- Maximum, minimum and average air temperature (ºC)
- Relative Air Humidity at 06:00 am, 09:00 am, 12:00 pm, 15:00 pm, 18:00 pm.
- Mean daily wind speed at 10m (m/s).
- Mean daily vapor pressure (hPa).
- Sum of precipitation (mm/ day).
- Potential evaporation from a crop canopy (ET0, mm/ day)
- Total global radiation (KJ/m2/ day)
-
- Snow depth (cm/day)
-
- Climatic data for Near Future projections (next 30 years). Agri4Cast Portal data is used with the same 25x25km grids. Data comes from SRES models Scenario A1B of the IV IPCC report. And the scientific models used are: RCM GCMs: DMI-HIRHAM5-ECHAM5, ETHZ-CLMHadCM3Q0, METO-HC-HadRM3Q0-HadCM3Q0. For the same variables as for the recent past, model-based daily data is loaded for the recent past and future projections.
- Crop yield compilation, average and variations of the last 15 years. This data is compiled at regional level (statistics) and at farm level (if there is no data available at farm level, regional statistics are used).
How does the ACZ tool work?
- The first step of the ACZ tool is to analyze climatic data. The tool allows us to review the occurrence and statistic data for the different climatic parameters, to assess the impact of climatic events on crop yields.
- The second step of the ACZ tool is to analyze crop yield data at regional level:
- Compilation of yields for the last 15 years.
- The tool analyzes the average yield and variations: exposition (frequency of years with unfavorable climatic events, %); and the impact due to unfavorable climatic events on best yields (%).
This information is of great important to assess crop vulnerability at farm level.
- The third step of the ACZ tool is to calculate the Agro-Climate Indicators (ACI): the key Agro-Climate Indicators that explain low crop yields at regional level. The tool performs an automatic calculation of more than 67 ACI for the recent past and the near future. For example, the number of days/year with maximum temperatures over 30º C in May, key indicator for cereal crops. It then allows us to define the key climatic events, thresholds and the key periods for their occurrence.
- Farm vulnerability tool:
- A farmer interview to get a farm description with information about the last cultural campaign, which includes economic, climatic and agronomic data (rotation practices, livestock management). All the data is at farm level and for each of the main crops or activities.
- Agronomic vulnerability scoring through the calculation of impact and exposure for the main crops (ACZ tool + experience), and through the calculation of vulnerability, updated with near future data.
- Animal vulnerability scoring based on fodder system, feeds resilience and animal welfare during heat waves, through the calculation of vulnerability, updated with near future data.
TOOL RELEVANT POINTS


![]()

